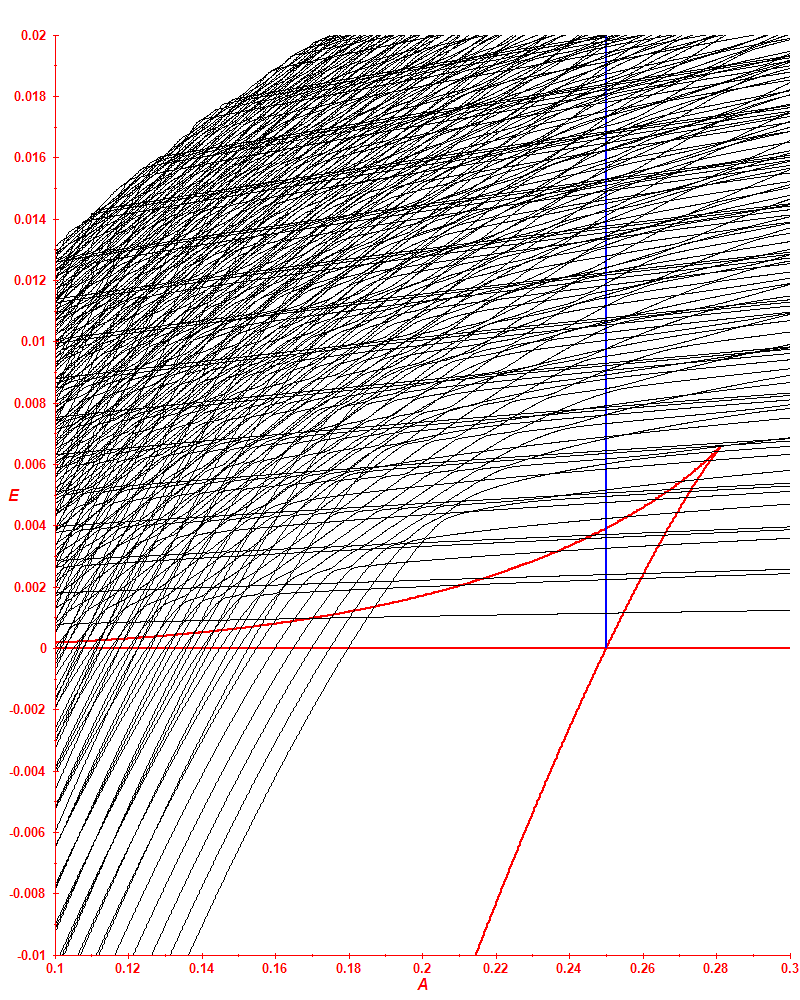
| Figure 1.
Level dynamics for B=C=K=1. Thick red lines correspond to the position of the deformed minimum, spherical minimum,
and the barrier between them.
Vertical blue lines mark the spinodal point A=0 and the critical point A=1/4.
The antispinodal point sits at A=9/32.
|
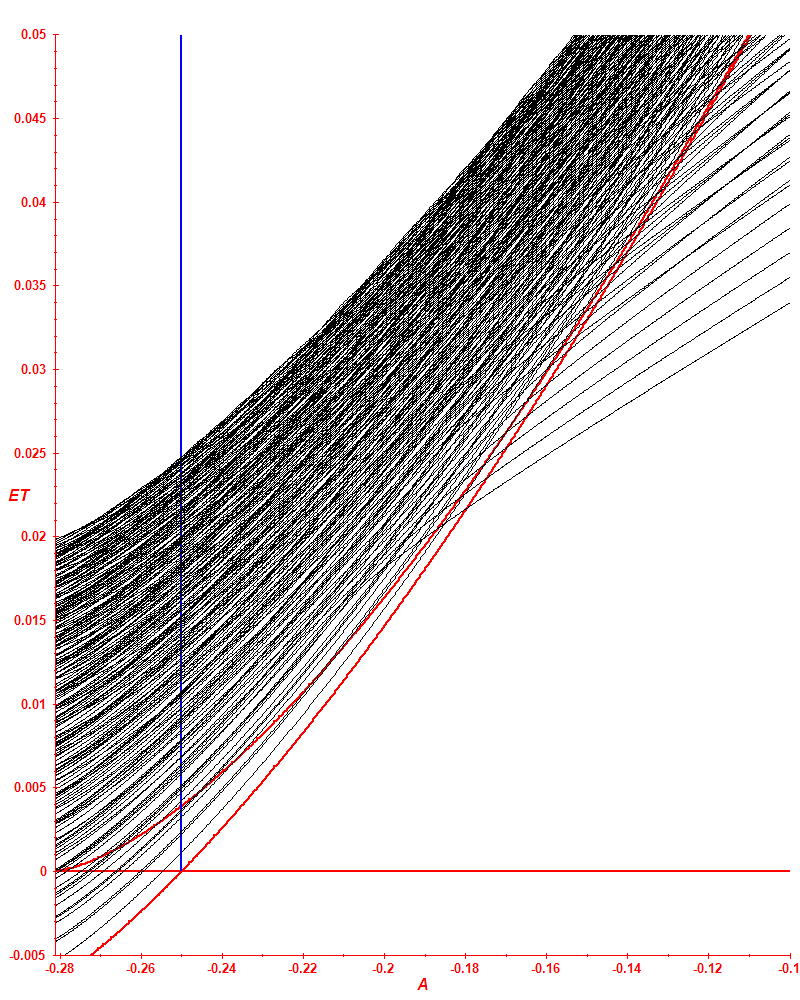
Figure 2.
Level dynamics of transformed spectrum ET=E-V(β2),
where β2 is the position of the deformed minimum.
The figure is mirrored with respect to the axis A=0, i.e. the deformed minimum is on the right and the spherical minimum on the left.
|
Figure 3.
A detail of Figure 2.
Thick grean and mangenta lines correspond to the estimated position of the "critical triangles"
on the zeroth and first γ excitation, respectively.
|


 Please wait...
